Suppose you're at a meeting with your friends. Suddenly, one of them, who owns an online store, makes the following comment:
"Ricardo, I'm worried about this month's sales, my conversion rate has dropped to 0.5%." Now, what did he mean by my conversion rate falling? How does this rate relate to the business?
In this article, you'll find the answers to all the above questions from two points of view: the importance of conversion rates for a business and their influence on other analysis metrics.
What Is Conversion Rate?
The conversion rate is a metric normally used to evaluate the efficiency of capturing leads or generating sales. But it is not restricted to these two actions, it can refer to any action you want the user to take.
This can include anything from clicking a button to making a purchase and becoming a customer. Websites usually have several conversion goals and each one will have its own conversion rate.
Here are some examples of conversions that go beyond making a purchase:
Budget requests;
Filling in forms;
Newsletter subscription;
Accesses to the strategy page;
Clicks on buttons, etc.
By analyzing your conversion rate, you can understand the efficiency of your site and also its influence on the results of your business as a whole.
Why do you need to track conversion rates?
The conversion rate is an indicator capable of generating performance analyses both for the business in general and for products in a portfolio. It will show your Return on Investment (ROI) and from this analysis you will decide what the next steps will be.
That's why it's important to constantly invest in Conversion Rate Optimization (CRO). By optimizing your existing structure, you can increase revenue and reduce costs without extreme measures.
How to Calculate the Conversion Rate?
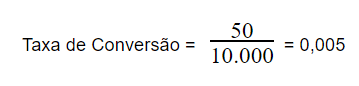
Let's say you want to find out the conversion rate based on the total number of visitors to your site. In this case, the conversion rate formula is as follows:
Understand how it works! Imagine you're Ricardo and your store sells shoes online. That month, your website had 10,000 hits and 50 people made a purchase. According to the formula above, we have:
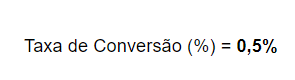
In percentage terms, it would look like this:
As a curiosity, the conversion rate varies according to the segment, but the global average is around 1.82%. This means that for every 1,000 visits to the site, 18 tend to convert!
How do I know if my conversion rate is good?
Conversion rates vary greatly according to the sector and business model. It's best to carry out conversion rate benchmarks to find out the average conversion rates for Google Search, Display, Shopping, Facebook and other platforms.
Knowing how good the conversion rate is is even more important for companies or startups seeking external investment. This metric is paramount for investors, as it shows whether the company is safe and worth making a bet on.
If you haven't yet carried out any comparative analysis of your conversion rate, there are good sources of information and benchmarking tools available on the market to help you at this stage.
How do I analyze my conversion rate?
To make it easier to understand, we're going to illustrate conversion rate analysis with a case study. Follow along!
Conversion Rate Analysis
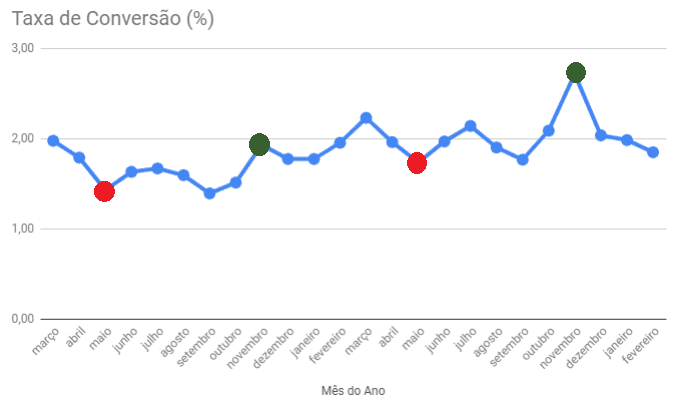
The graph below represents the monthly conversion rate of an e-commerce business over a 24-month period, starting in March 2017.
Evolution of the Conversion Rate over 24 months. Source: Pareto Group.
By analyzing the graph above, it is possible to identify two market trends.
Conversion Rate Growth
The first relates to the constant growth in the conversion rate each month, indicated by the linear regression (red line).
Linear analysis of the evolution of the conversion rate over time (red line). Source: Pareto Group.
This analysis is an indicator of the evolution of the business as a whole! There are several influencers in this evolution, among them we can mention:
The second conclusion is to identify the seasonality of the business. Going back to the first graph, we can identify times of the year when the rate varies outside the standard deviation.
The highlighted points on the graph represent a time of high and low seasonality. Where the green dots indicate periods of high seasonality and the red dots indicate periods of low seasonality.
Seasonality analysis, dots in red (low seasonality) and green (high seasonality). Source: Pareto Group.
Therefore, it can be said that historically the month of May has had the lowest conversion rate, while November has had the highest.
How to Use These Insights?
For an e-commerce business, for example, launching a new product in a month with a low conversion rate can negatively affect the product's market acceptance.
Another point is the fluctuation in marketing investment. Increasing investment in high conversion rate months and reducing it in low conversion rate months are interesting actions for boosting revenue!
How Does Conversion Rate Relate to Other Metrics?
Analysis metrics, especially in Google Analytics, interact in different ways, i.e. each one has a direct or indirect influence on all the other metrics.
Here are the most important ones when compared to the conversion rate!
Conversion Rate X Volume of Marketing Investment
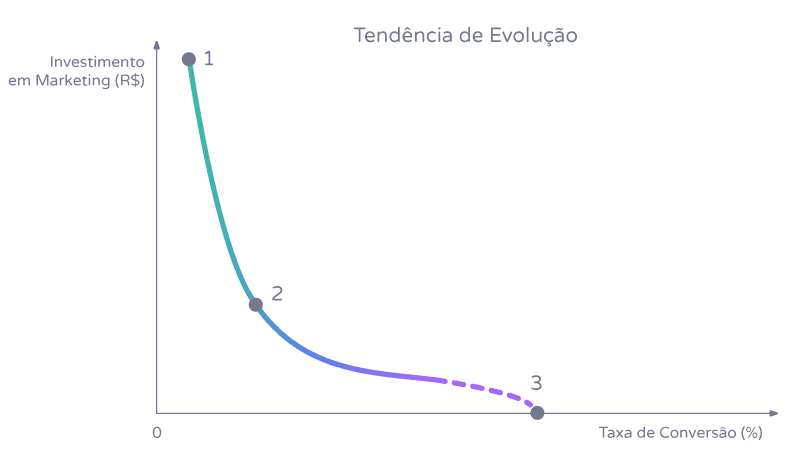
The graph below shows the relationship between investment volume and conversion rate. There are 3 characteristic points in this graph:
Investment vs. conversion rate graph. Source: Pareto GroupPoint 1 - The more a company invests in digital marketing, the lower the conversion rate. If a company invested 1 billion in digital marketing, a large part of that investment would not bring a direct return in sales in the short term.
This means that when you bring new users to your site, most of them won't be qualified enough to convert on their first interaction. This is very common in Awareness investments, i.e. to generate broad brand awareness among a certain audience.
Point 2 - Optimum investment point in terms of conversion rate. At this point, we have reached the ideal ratio between what has been invested and the number of conversions. In other words, you've spent enough on marketing to have a good volume of customers who actually convert.
Point 3 - When the investment in marketing reaches 0, the number of visitors to the site tends to drop dramatically, thereby increasing the conversion rate. Then, the few hits that remain are from people who already know the brand, so the conversion rate goes up. However, each business has its own maximum conversion rate, which is independent of investment.
Conversion Rate X Page Load Time
Does page time influence a website's conversion rate? Yes, a lot!
Sites with loading times above the market average tend to lose visitors quickly, as the graph below shows:
Page Load Time X Conversion Rate. Source: Pareto Group.Point 1 - A site that loads too slowly is responsible for affecting the user experience. Waiting a long time to open a product or load a video on the page will frustrate the user and reduce the likelihood of conversion.
Point 2 - Considered the break-even point, with loading times of around 3 seconds. This level of loading efficiency is possible with a well-structured site, organized coding and web-optimized images. At this point, it is understood that the site already has a team focused on analyzing the structure of the site.
Point 3 - High loading performance. Achieving this level of improvement requires a high-performance technology team, intelligent coding and a high level of investment.
Now that you've learned how to calculate your conversion rate and understood which metrics influence your result, you can understand how your site's conversion rate is behaving over time.
For more help, get in touch with Pareto Experts now!
 Understand how it works! Imagine you're Ricardo and your store sells shoes online. That month, your website had 10,000 hits and 50 people made a purchase. According to the formula above, we have:
 Understand how it works! Imagine you're Ricardo and your store sells shoes online. That month, your website had 10,000 hits and 50 people made a purchase. According to the formula above, we have:
 In percentage terms, it would look like this:
 As a curiosity, the conversion rate varies according to the segment, but the global average is around 1.82%. This means that for every 1,000 visits to the site, 18 tend to convert!