Depois de criar páginas de destino, escolher criativos, escrever e-mails, determinar o texto dos botões e CTA, como você prevê as interações das pessoas e o resultado da sua campanha? Você confia apenas na sua intuição?
É nesse momento que realizar um Teste A/B é fundamental! Ele revela qual versão da sua campanha apresenta a melhor performance e, consequentemente, maior taxa de conversão.
Continue lendo para saber como planejar todo o processo de teste A/B . Ao final, vamos mostrar como é simples rodar um experimento com o Pareto Ads!
O Que É Teste A/B?
O Teste AB é uma metodologia de comparação de duas versões de uma webpage, app, públicos ou anúncios para determinar a partir de uma variável de comparação, qual delas traz o melhor resultado.
Ele também é conhecido como teste de divisão em que é realizada uma experiência de marketing na qual você divide seu público para testar várias variações de uma campanha e determinar qual tem melhor desempenho.
Todo Teste A/B deve ser baseado em hipóteses formuladas a partir do conhecimento e dos diferenciais da sua marca. Para isso, o ideal é que você estabeleça um cronograma de testes que deseja realizar. Assim, as informações são testadas por partes.

Por Que os Testes A/B São Eficientes?
O Teste AB tem o objetivo principal de gerar um incremento de performance, tal como:
- Aumentar a Taxa de Conversão;
- Reduzir a Taxa de Rejeição do site;
- Aumentar a expectativa de Venda/Lead entre Públicos.
É possível separar os testes por etapa de funil de marketing, atingindo públicos em diferentes momentos de sua jornada de compra. Veja na imagem abaixo que podemos iniciar testando anúncios, depois Landing Pages e por fim e-mails de boas-vindas:

O Que Testar?
Confira as possibilidades de Teste A/B separadas de acordo com as etapas do funil de marketing:
Anúncios
É possível testar variações de anúncios, como por exemplo a troca do Copywright, fazer mudanças no criativo (em caso de imagem), substituir a cor de um CTA ou até mesmo a frase do botão.
- Imagem;
- Texto;
- Botões de CTA;
- Público;
- Formato.
Landing Page
O universo das LP’s é ainda mais amplo. Você pode trocar o banner principal, aumentar o número de CTA’s na página, trocar a cor, substituir campos de um formulário, apresentar/esconder o preço do serviço de um produto.
- Títulos;
- Intertítulos;
- CTAs;
- Imagens;
- URL;
- Campos do formulário;
- Descrição do produto;
- Elementos visuais .
Possui aspectos similares ao anúncio, porém neste caso já temos o e-mail do cliente. Dessa forma, supõe-se que houve um primeiro contato com a sua empresa (por isso estamos numa etapa de fundo de funil).
Logo, é possível mudar a comunicação do e-mail, testar o uso de imagens de categoria ou produto, CTA’s, links de redirecionamento e mais variações.
- Títulos;
- Intertítulos;
- CTAs;
- Imagens;
- Elementos;
- Data e hora dos envios.
Como o Teste Impacta a Performance?
Para uma empresa de B2B, o foco principal é aumentar o volume de Leads qualificados. Já em termos de um e-commerce, o objetivo final é aumentar o volume de vendas e gerar maior receita.
Contudo, em ambos os casos, o teste A/B poderá solucionar os seguintes pontos:
a. Melhorar a experiência do usuário;
Exemplo de Teste A/B
b. Melhorar a qualificação do tráfego;
c. Reduzir a taxa de rejeição;
d. Fazer alterações controladas no site com baixo risco;
e. Ter resultados com confiabilidade estatística.
Um teste estatístico deve ter um sentido racional, e não ser uma tentativa aleatória. Neste caso, nós definimos uma hipótese a partir do conhecimento do negócio. O ideal é encontrar algo que diferencie você dos seus concorrentes, de forma que isso permita melhorar a métrica que você escolheu como objetivo.
Aqui na Pareto, nós definimos a melhor métrica para focar, dependendo da etapa do funil da sua campanha e do volume de dados da sua conta. Se a sua empresa já passou da fase de aprendizagem, já terá acumulado muitas informações, então poderemos realizar um teste mais avançado.
Nós desenvolvemos um modelo padrão para facilitar a criação da hipótese, basta preencher as lacunas:
SE meu anúncio variar ……………………………… LOGO eu espero otimizar meus resultados PORQUE ……………………………….
Veja um exemplo de variação de anúncio:

Quando os anúncios são publicados, existe uma frequência de impressões de 50% para cada uma das versões: a versão A e a versão B do anúncio e os resultados serão monitorados até o final do período do teste.
Quanto mais dados coletados, mais precisas serão as decisões. Depois de acumulados dados suficientes do anúncio original e da variação, é feita a comparação e, então, determinamos qual deles teve melhor desempenho.
O Teste A/B pode ser criado com o auxílio da ferramenta do Google Ads que permite fazer experiências de anúncios. No final do teste, teremos uma confiança de 95% para afirmar qual foi o anúncio vencedor. E então, é feita a sugestão para pausar o anúncio “perdedor” a fim de manter apenas o “ganhador”.
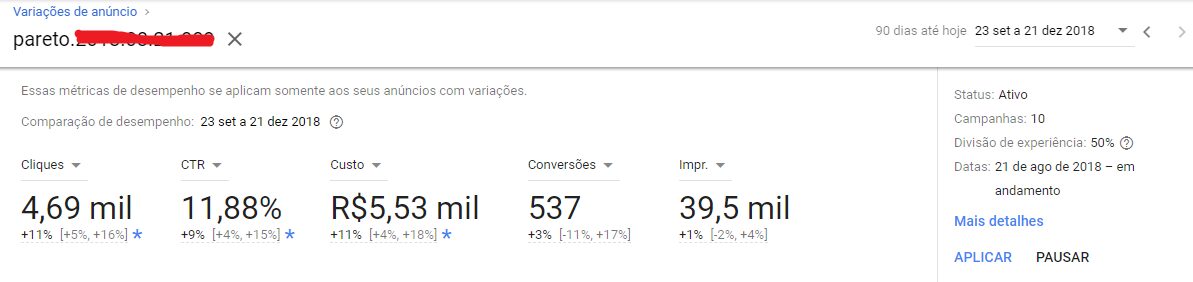
Veja, a seguir, um exemplo de um resultado do teste A/B em uma campanha. Podemos ver um comparativo de cliques, CTR, Custo, Conversões e diversas outras métricas.
 Com isso, estaremos economizando, já que um anúncio mais eficiente gera cliques mais qualificados, possibilitando uma maior taxa de conversão. Além disso, o índice de qualidade será melhor, permitindo que os lances das palavras-chave sejam reduzidos sem prejudicar o ranking de posição.
Como Fazer um Teste A/B?
É possível separar o teste AB em cinco etapas: Pesquisa, Observação e Formulação de Hipótese, Criação da Variação, Execução e Análise do Resultado.
1. Pesquisa
A pesquisa consiste na análise dos dados atuais. Busca responder a principal pergunta: “Como estou hoje?”.
Pode parecer simples, porém para cada teste, temos uma plataforma de dados, com métricas diversas de análise. Criar um teste A/B sem a devida pesquisa poderá causar impactos mínimos de performance.
Portanto, aplicando o princípio de Pareto (80/20) é importante para alinhar a estratégia do teste com o objetivo que quer ser alcançado.
Para cada teste temos uma plataforma específica de direcionamento, dentre elas:
– Google Analytics – Teste no site como um todo (por exemplo, uma LP);
– Facebook Ads – Teste de Público, Anúncios, Posicionamento;
– Google Ads – Teste de Público e Anúncios;
– Firebase – Teste de Aplicativo
2. Observação e Formulação de Hipótese
Esta é a etapa mais crítica! Criar um teste sem uma hipótese é análogo a fazer uma viagem marítima sem bússola. Ou seja, é percorrer um caminho sem rumo e com a incerteza de chegar em algum lugar.
Antes de darmos continuidade, vamos aprofundar o conceito de hipótese. A hipótese é uma afirmação criada em linguagem simples que deve ser desafiada.
Vejamos um exemplo de Hipótese aplicada a um anúncio da Pareto:
Hipótese: Anúncios da campanha de Marca da Pareto tem maior número de cliques quando utiliza-se o termo Teste Grátis na Headline 2.
3. Criação da Variação
Com base na hipótese, vamos colocar a afirmação em teste, criando um grupo variação e outro controle (o original).
É possível criar um teste com múltiplas variáveis, entretanto, quanto mais simplificado for o teste, menor será a sua duração. E maior será a eficácia na determinação do real motivo da melhora de performance! Veja neste outro artigo uma explicação sobre Experimentos Estatísticos de Anúncios.
Dando continuidade ao exemplo da Pareto:
Grupo Controle:

Grupo Experimento:

4. Teste
Criada a variação, temos que colocar o teste em prática!
É importante retirar quaisquer variáveis tendenciosas aplicadas durante o teste. Por exemplo ao testar o anúncio acima, o ideal garantir que o número de impressões ou o investimento para cada variação permaneça o mais próximo possível.

5. Análise dos Resultados
Concluído o Teste AB, chegou a hora de analisar os principais resultados gerados. Devem ser avaliadas métricas de performance importantes, como: Custo, cliques, CTR, conversões, CPA ou ROAS, dentre outras.
Vamos ao exemplo:
Grupo Controle

Custo: R$4.000
Cliques: 3.785
CTR: 4,25%
Conversões: 112
CPA: R$ 35,12
Grupo Variação

Custo: R$4.050
Clique: 4.003
CTR: 5,12%
Conversões: 96
CPA: R$ 42,18
E agora? Qual é o melhor anúncio?
Seguindo a hipótese testada acima, de que o termo “Teste Grátis” aumentaria o número de cliques, temos que o anúncio vencedor é a Variação. Pois tanto o número de cliques (+5,7%), quanto o CTR (+20,5%) é maior quando temos “Teste Grátis” na Headline 2 do Anúncio.
Porém, analisando em termos de conversão, é possível perceber que o número de conversões caiu de uma variação para outra, tendo assim um aumento de 34,6% no CPA.
Logo, em termos de cliques, de fato o exemplo apresenta uma performance superior. Já em termos de conversão, a resposta é completamente oposta. Agora é só aplicar o teste nos anúncios da conta!
Como Medir seus resultados com o Pareto Ads?
No Pareto Ads, temos uma card de otimização One Click específica para testes A/B de anúncios!Então, sempre que dois anúncios estão rodando para o mesmo público, nosso algoritmo automaticamente roda um teste entre eles e consegue informar os resultados, quando encontrar um resultado estatisticamente significante.Para isso, é preciso ter um volume de dados suficiente para que as métricas sejam relevantes para essa conclusão. Recomendamos a aplicação de experimentos acima de 80% de confiança estatística para os melhores resultados.Veja o exemplo abaixo, como a Card de Experimento de Anúncio irá aparecer, tanto para Google quanto para Facebook: O algoritmo identifica o teste que está sendo aplicado na sua conta de Google Ads, avaliando os anúncios da conta naquela campanha e grupo de anúncios específicos.
Na mesma One Click, você consegue visualizar qual é o teste que foi feito e os resultados! Neste caso, a variação principal é a troca de Headline 2.
São apresentadas as métricas do teste, com o resultado estatístico e já apresenta o anúncio vencedor e o perdedor. Neste caso, a métrica de avaliação é o CPA (Custo por Aquisição).
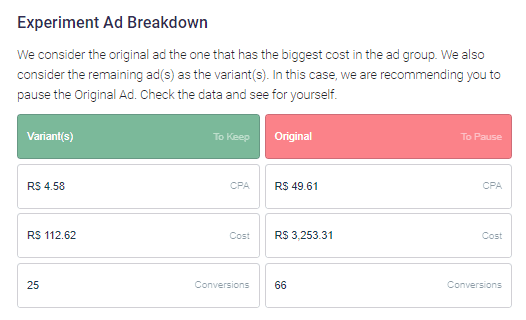


E algo que facilita incrivelmente na sua gestão: o Pareto Ads executa o teste com apenas um clique no botão “Execute” (Executar). Assim, o anúncio perdedor é pausado automaticamente na sua conta!
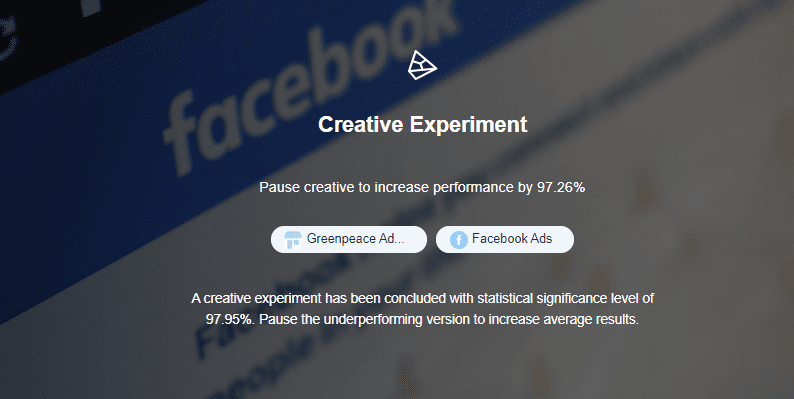
Agora, vejamos um exemplo de One Click de Experimento de Anúncio no Facebook Ads. Nesse caso, o algoritmo está avaliando os criativos que estão rodando para o mesmo público. Também temos todas as informações relevantes, além da significância estatística e prévia dos criativos que estavam rodando para a tomada de decisão.

Neste artigo, você conheceu melhor as etapas importantes na configuração de um Teste A/B e como a Pareto ajuda a aplicá-lo em seus anúncios de Google Ads e Facebook Ads.
Após terminado um Teste A/B, você pode prosseguir com o cronograma de testes, sempre com o objetivo de melhorar ainda mais a qualidade do anúncio (ou a variável que foi testada). Novas informações podem ser testadas sucessivamente. Esse ciclo virtuoso é fundamental para a otimização das campanhas.
O Teste A/B é uma excelente oportunidade de economizar dinheiro e tornar suas campanhas ainda mais eficazes. Mas, lembramos que, se não for definido de maneira adequada, em vez de trazer otimização e economia às suas campanhas, poderá causar prejuízo com a alocação de verba em testes não produtivos.
Além disso, fique atento à confiança estatística do resultado de seu Teste A/B, defina os prazos de maneira adequada para que os dados coletados sejam suficientes. E, dessa maneira, sejam tomadas as melhores e mais confiáveis decisões para suas campanhas.