Introdução
Este artigo tem o objetivo de te apresentar o que você vai encontrar na aba de “Risk Analysis”, no nosso Pareto.io. Assim, ficará por dentro de métricas super importantes para a análise da sua conta de Google Ads!
Essa análise foi criada pela Pareto especialmente para apresentar informações importantes sobre estrutura, expansão e otimização da conta.
O que é a aba Risk Analysis do Pareto.io?
Primeiramente, você chega até a aba Risk Analysis clicando no menu superior da plataforma. Cliquem em “Marketing” e depois em “Risk Analysis”. Veja a imagem abaixo:

E o quê você vai encontrar de bom nessa aba do Pareto.io? Muita coisa!!
As informações tiradas dali, permitem fazer análises e trazer ideias de diversos pontos de melhoria na sua conta. E então, vamos explorá-la?
Índice de Risco (Risk Score)
A Pareto criou o premiado “Risk Score” (Índice de Risco), baseado nos princípios do mercado financeiro. Com ele, você poderá avaliar se sua conta está bem otimizada e qual o risco que ela correndo.
Usando nosso super algoritmo, calculamos quão bem estruturada está a conta, a partir de diferentes parâmetros que vamos apresentar mais a frente. Veja o exemplo da conta da Pareto:

Um “Risco alto” significa baixa otimização. Já um “Risco controlado” vai indicar otimização alta e expansão agressiva, assim como investir em ações. Por um, um “Risco baixo” significa otimização alta, mas pouca expansão, assim como investir em uma poupança.
Além disso, você também vai encontrar um gráfico que mostra a evolução do seu Índice de Risco ao longo do tempo. Assim, é possível entender como sua conta evoluiu.
As barras vermelhas significam flutuações negativas, as barras verdes mostram flutuações positivas e as barras cinzas mostram comportamento constante do índice.
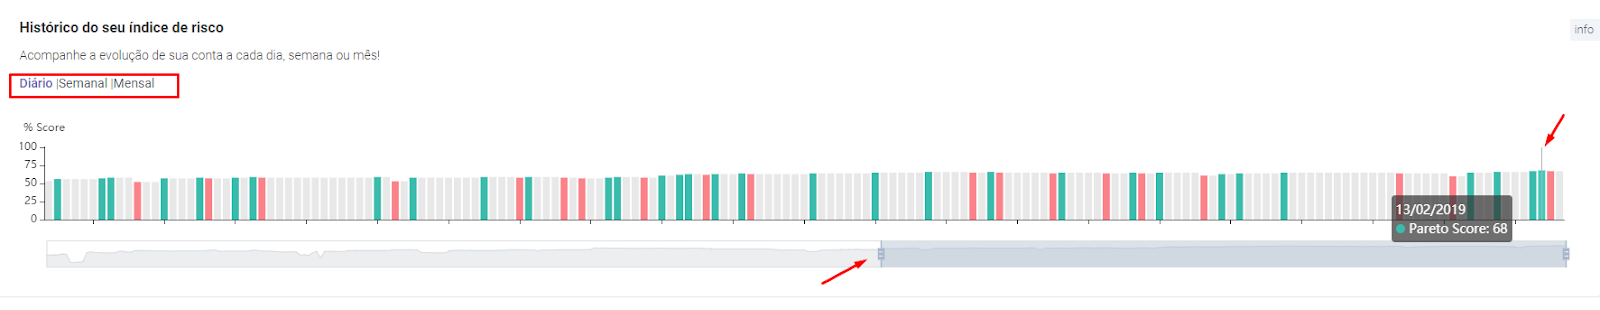
Repare que abaixo do gráfico existe uma “régua” onde você pode selecionar o período de tempo que deseja observar no gráfico. Passando o mouse em cima das barrinhas, é possível ver o seu Pareto Score naquela data. =D
Além disso, é possível analisar cada uma das possibilidades de otimização por trás do Índice de Risco! Veja em detalhes cada oportunidade de aumento de lucratividade que sua conta possui!
O que está por trás do Índice de Risco?
Agora que a gente já sabe o que significa o Índice de Risco, que tal entender as métricas que estão por trás dele?
Este índice é calculado a partir de avaliações de quase 30 indicadores, que envolvem diferentes categorias. Através delas conseguimos encontrar muitas oportunidades de melhoria na conta!
Aqui na Pareto, consideramos algumas importantes categorias de análise: Estrutura da Conta (Account Structure), Eficiência de Custo (Cost Efficiency), Segmentação (Targeting), Performance de Anúncio (Ad Performance), Qualidade do Rank (Rank Quality).
Através do Gráfico Pareto Radar é possível ver rapidamente quais áreas da sua conta estão mais vulneráveis e quais você tem mais controle sobre.
Veja o exemplo abaixo do gráfico Pareto Radar da nossa própria conta. Lá na plataforma, é possível ver os valores de cada métrica.

Categorias e Indicadores Importantes
Agora, vamos falar um pouco dos indicadores que compõem essas categorias do nosso Índice de Risco.
Para ver em detalhes esses indicadores da sua conta, basta selecionar a categoria desejada. Assim, é possível aprofundar seu estudo e descobrir o que precisa ser melhorado em sua conta.
Lá na plataforma, você poderá analisar cada métrica que calculamos para gerar seu Índice de Risco. Divirta-se encontrando cada detalhe que pode ser otimizado na sua conta para melhorar seu resultado!
Nosso avançado algoritmo fornece diferentes pesos para cada métrica. Para isso, considera a importância de cada uma.
Categoria 1: Estrutura da Conta
Agora, vamos para a primeira grande categoria. Ela avalia a Estrutura da Conta.
Alguns indicadores que influenciam nessa métrica são: o Rastreio de Conversão e a Habilitação do Modelo de Atribuição. Ou seja, se sua conta está rastreando as conversões da melhor maneira possível. E aqui na Pareto conseguimos fazer o rastreio do site de uma maneira bastante eficaz!
Outros 2 indicadores sobre estrutura, indicam a forma com que as campanhas estão estruturadas na Estrutura de Pareto e o quão eficiente está a sua Campanha de Marca.
Além disso, outros indicadores importantes envolvem a importação de métricas das demais plataformas de análise, como o Search Console e o Google Analytics. Estes são importantes para vincular dados do tráfego orgânico e de diversas métricas de performance relacionadas ao site.

Categoria 2: Eficiência de Custo
Passando para a próxima grande categoria que compõe o nosso Índice de Risco, temos a Eficiência de Custo.
Um dos indicadores desta parte envolve a eficiência de negativação e ativação de termos de pesquisa. Ele avalia quantos termos de busca já acionaram seus anúncios e quantos deles são controlados por você.
É importante ter um bom controle dos termos que ativam seus anúncios para não pagar por cliques desqualificados.
O segundo, avalia se a conta está utilizando listas de remarketing para melhorar a performance de custo da conta.
Leia mais em: Os 7 Melhores Públicos de Remarketing para Google Ads
Também temos a chamada Razão de Pareto, que avalia se sua conta está equilibrada em termos de proporção de gasto com termos que possuem ou não conversão.
Por fim, o último indica a proporção de investimento em palavras-chave amplas, dado que esse tipo de correspondência não é a mais eficiente.

Categoria 3: Segmentação
A próxima grande categoria é a Segmentação, que irá mostrar se estamos aplicando modificadores de lance. Alguns dos avaliados são os de Idade, Status Parental (ou seja, se a pessoa tem ou não filhos), Gênero, Localidade e Dispositivo (Celular, Computador e Tablet).
Além disso, consideramos se existe alguma programação para os anúncios com modificadores de lance conforme o horário do dia e dia da semana.
Quanto maior a nota desta categoria, significa que você tem mais controle sobre a conta.
Leia mais neste artigo: O que são os Ajustes de Lance no Google Ads – Conheça os 6 Principais

Categoria 4: Performance do Anúncio
Outra grande categoria do nosso Índice de Risco mede a Performance do Anúncio.
O primeiro deles, considera se está sendo priorizado os anúncios com o melhor desempenho, através da rotação otimizada.
É avaliado, também, se existem Extensões de Anúncios. Estas trazem mais relevância e aumentam seu índice de qualidade. Algumas das principais Extensões são: Sitelinks e Frase de Destaque.
Outro item importante são os experimentos de anúncios. Estes indicam quantos dos seus grupos de anúncios estão com mais de uma anúncio. Assim, possibilitamos a realização de testes estatísticos para mostrar qual deles é mais eficiente.

Categoria 5: Qualidade do Rank
Enfim, chegamos à categoria de Qualidade do Rank, dentro do nosso Índice de Risco.
A Pareto é uma das poucas empresas do mundo em apresentar um valor numérico para o Índice de Qualidade da sua conta (calculado baseado no Índice de Qualidade do Google Ads). Ele vai mostrar se você está se saindo bem nos leilões de palavras-chave em comparação aos concorrentes.
Outros indicadores desta categoria incluem a taxa de cliques prevista, a relevância do anúncio e a experiência na página de destino.
Leia mais em: Índice de Qualidade do Google Ads: O Que É e Como Melhorar?

Conclusão
Então, essa foi a Aba “Risk Analysis” do Pareto.io. Lá, você vai encontrar informações preciosas sobre sua conta no Google Ads!
Então, agora que você já está por dentro de todas as informações disponíveis na aba “Risk Analysis” do Pareto.io, corre lá e dá uma olhadinha! Assim, você vai ter uma boa noção do que está sendo feito na sua conta e no que ainda pode ser trabalhado. =D
Se você quiser saber mais sobre a Pareto e o Pareto.io, é só conferir nosso site!