Highlights of Brazilian E-commerce
Do you already know the main trends for e-commerce in 2019? We've separated and commented on the most important information from Brazil's main e-commerce report: Webshoppers! Here are the main topics we're going to cover in this article!
- E-commerce and E-consumers on the rise in the post-crisis period;
- Low growth in the average ticket following milder inflation;
- Mobile devices are increasingly used as a purchasing channel;
- The average age of the consumer is 43, but young people are appearing more after the economic crisis;
- Customer monthly family income of R$ 6,475, with a high participation of classes C, D and E;
- Strong expansion of e-commerce in the south of the country;
- Reduction in average installment payments and increase in cash payments;
- Decoration, Home Appliances, Electronics, Sports and Leisure, Computers, Fashion, Health and Telephony are the sectors that stand out in virtual retail;
- Omnichannel as a success formula for logistics;
- Truckers' strike affecting 20% of sales potential;
- Digital Commerce is booming, earning twice as much as E-commerce.
Webshoppers? Ebit? What are they? Where do they live? What do they eat?
Webshoppers is a study of the Brazilian e-commerce market carried out every six months by Ebit since 2001. It shows some of the sector's characteristics, such as target audience, turnover, average ticket and best-selling categories.
Ebit is a company belonging to the Nielsen group (a global data measurement and analysis company) which has been studying the evolution of digital retail since 2000 and is one of the biggest references when it comes to e-commerce.
More than 30 million consumer reviews have already been collected from more than 25,000 partner online stores, not only at the time of purchase, but also at the time of delivery and afterwards to study the use of the product.
Analysis is not limited to consumers alone! Ebit evaluates its partner online stores through a certification that can help increase traffic, conversion and SEO.
The seals range from bronze to diamond, depending on aspects such as security, on-time deliveries, the likelihood of customers returning to the store and the number of reviews related to the purchase and delivery.
At the end of each year, the Ebit Awards, the most traditional in e-commerce, are held to recognize online stores that have performed outstandingly. Each year certain categories are chosen, such as best platforms, executives, diamond stores, among others.
Understand your online store's audience!
Understanding the characteristics and trends of your e-commerce audience is essential to achieving good results!
Mobile device trends
The first insight concerns the purchasing channel and the upward trend in mobile commerce, selling via mobile devices.
In the middle of 2018, 32% of e-commerce transactions were carried out via smartphones or tablets.
Compared to the same period in 2017, m-commerce had a 30% and 41% higher turnover and number of orders, respectively.
The average ticket fell by 7%, making it 11% cheaper than the average price for purchases of computers and notebooks.


Looking at the historical graph, it's clear to see how much mobile devices have gained strength over the years.

The trend is explained by the growth of the smartphone and tablet market and the increase in internet access in Brazil, a factor that contributes to more consumers making digital retail purchases.
Increase in total consumers
In the first half of the year there were 27.4 million consumers, an increase of 7.6% compared to the same period in 2017. On a YoY basis, the last two years have seen strong double-digit growth.


Expanding participation by the female public
In the period, women accounted for the largest share of purchases in this sector, as did people over the age of 35. The average age of virtual retail customers was 43.

As the gender history didn't provide much insight, the values always fluctuated around 50%, we didn't do an analysis on it.
Data by Age Group
As for the age group graph, it shows how in years of crisis, consumption decreases among young people, a group with a lower income, and how this has been changing since last year with the reduction in the average age.

Income brackets, social class and regions of Brazil
This semester, consumers in the lower income brackets had a greater share, especially classes C and D, accounting for around 80% of the total.
The average family income was R$6,475.
The same percentage of participation took place in the country's most developed regions, the Southeast and South, where the average income is higher among families.

The evolution of family income shows us that in the years of the crisis, the lower-income (and higher participation) public found it more difficult to go shopping, a trend that was reversed in the post-crisis period.

In the regional analysis, the southern and northeastern states have shown increasing participation since 2016. The increase of 1.8 million requests from the South in the middle of the year stands out.

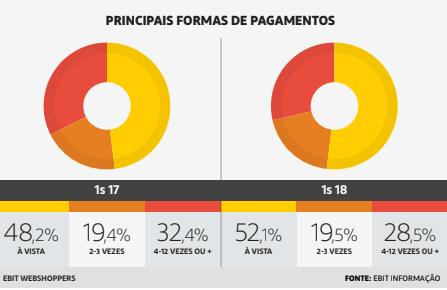
Payment methods: Cash or installments?
Concluding the analysis of the public, there has been a change in the way consumers pay for their online purchases, with an increase in cash payments and a reduction in installment payments.


But does e-commerce really work? What sells the most?
Average Ticket, Sales Volume and Turnover
The year 2017 shows us a still slow recovery with an increase of 8%, a turnover of R$47.7 billion and a volume of 111.2 million orders.
The first half of 2018 has already shown a 12% expansion, expected by the end of the year, resulting in R$53.4 billion in sales and 120 million orders.
The average ticket for the products sold has been growing at a low rate, but this is a reflection of the inflation we are currently experiencing.


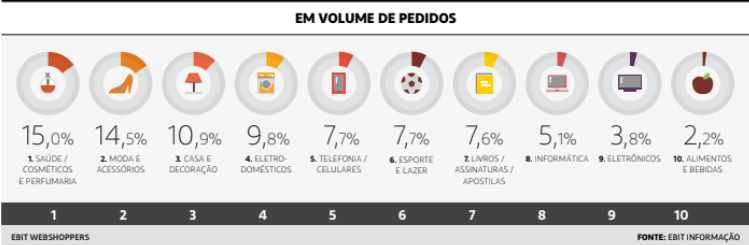
Categories with the most sales
An analysis by sector within e-commerce allows us to understand which categories sell the most and how much they sell.
In terms of the number of orders, the most popular sectors were health, fashion, decoration, household appliances and telephony.
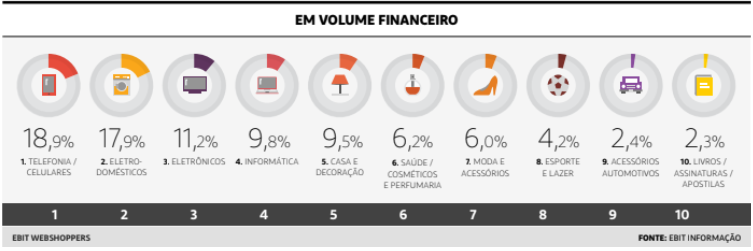
When it comes to financial volume, the telephony, household appliances, electronics, IT and decoration sectors stand out.
Looking at growth over the period, the highlights were Sports and Leisure, Electronics, Decoration and Health.

Ah, but if you're going to talk about finance and e-commerce, you have to talk about logistics!
In fact, logistics says a lot about the operation of an e-commerce business, directly impacting customer satisfaction and, therefore, the company's sales.
Freight price
When it comes to the price of shipping, it's interesting to note how its gratuity has been falling in the biggest online stores in the search for better financial results
Then there was a reversal with the growth of the Marketplace, since in this market full of suppliers and products, not paying for transport is a strong argument for winning a customer.

Delivery time
With regard to delivery times and customer satisfaction, we can see that the omnichannel is gaining ground.
The term means the convergence of the channels used by companies, i.e. the integration of sales between physical and virtual stores with the end consumer.
The Ebit survey tells us that the 10% of orders picked up in the physical store had the best levels of satisfaction, because customers can satisfy their needs wherever and whenever they want, at the most comfortable time.


Even with a lower delay rate than private carriers, the Post Office had a very low level of satisfaction. This is believed to be due to the lack of differentiation in the products delivered.


What about the Truckers' Strike?
It's also interesting to note the negative impact of the truckers' strike on 2018 results, as the number of delays soared, while sales plummeted.
The data captured by Ebit indicates losses of R$407.2 million in the sector, or 20% of the sales potential in this period.

Extra! Extra! Digital Commerce and its significant rise
What is Digital Commerce?
First of all, let's get this out of the way. After all, what is digital commerce?
Its main difference is that the entire purchase journey will be influenced by a digital channel, i.e. there is no influence from physical stores, the consumer can make the purchase at any time and place, whereas in e-commerce it is enough to make the purchase using an electronic device.
Digital Commerce highlights
There were three areas studied in Webshoppers 38, Marketplaces (B2B and C2C), Tourism and Tickets for concerts, cinemas and sporting events.
It's worth noting that digital commerce earned R$112.19 billion in 2017, up 19.9% on 2016, more than double the e-commerce market.


Marketplaces analysis
The marketplace model is booming. The market for new and used products had a market share of 16.9% in 2016, rising to 22.9% the following year, a nominal growth of 62.4%.
The timing couldn't be better: the economic crisis has boosted the search for cheap alternatives. As the marketplace offers a large number of suppliers and products, this translates into low prices and variety for the consumer.
In addition, the growth in the number of smartphones in the country and the fact that retailers don't need to make huge efforts and investments to structure their own e-commerce have resulted in this expansion.
Tourism Market Analysis
The online tourism market had the second highest nominal growth in digital commerce, 17.8% compared to 2016. Its share of the sector was 31.3%.
It is important to note that this growth occurred in a year in which the number of travelers and international trips (due to the devaluation of the real) fell.
On the other hand, we are seeing an increase in short journeys within the country, with an increase in the use of cars and buses as means of transportation.
It's worth noting that, as with e-commerce, desktops are still the majority of shopping devices, but are losing ground to smartphones and tablets.


Ticket Market Analysis
Finally, the online ticket market comes in with revenues of R$3.7 billion, nominal growth of 4.8% and a market share of 3.3%.
Despite the modest figures, the sector is promising with more and more frequent events in the country (World Cup, Olympics, Rock in Rio, Lollapalooza, concerts).
A major barrier in the sector is the price of the convenience fee, which according to Procon can be as much as 20% of the ticket price.
Conclusion
The growth of Brazilian e-commerce is therefore evident. This growth is even more significant in the cases of digital commerce and m-commerce.
The time to ride this wave is now, by setting up your new online store or looking for improvements to your more mature store.
One alternative is to structure an optimal digital marketing strategy with the help of Pareto Group. Here we focus on the optimizations needed to bring the best results to your marketing campaigns.
Other powerful insights to study in your business are the characteristics of the target audience and the main sales channel. If you're more interested, read this article on Audience Research by Social Network in Brazil and the World.