In this article, we're going to show you how to attract your audience's attention using the Storytelling with Data technique.
During the learning process, a lot of information about language and mathematical operations is taught. In language, the processes of forming words, constructing sentences and stories, among others, are taught.
As for mathematics, the emphasis in teaching is on enabling everyone to understand numbers and carry out operations. However, these two processes, language and mathematics, are rarely taught together, i.e. how to tell stories with numbers.
We call this principle Storytelling with data. Just as technology makes it possible to work with large volumes of data, there is also a growing desire to understand it.
Although there are many tools for working with data, there are still some gaps to be filled. For many people, all they have to do is create a graph and that's it! However, there is a story in that data.
This story is only known by those who analyze the data, not by the data visualization tools. And the latter must fully reach those to whom the data will be presented.
Storytelling with data is a learning journey. In this article, we will present some approaches related to the process of desaturation of data visualization.
What is saturation
One of the great challenges in data visualization is the so-called Saturation. We define saturation is defined as visual elements that take up space in a graph, for example, but do not enhance understanding. Contributing to excessive cognitive load.
To make the desaturation path more attractive, let's present a practical example of how to identify and remove saturation from a graph. To do this, consider the following hypothetical scenario:
Example scenario:
Imagine that you manage a team of operators on a construction site, where each operator is responsible for reassigning materials for later use. In the last year, two operators have left your team and, at the time, you decided not to replace them.
The other operators began to complain that the current number of employees was not enough to meet the demands. As a result, materials could not be moved in a timely manner, which could delay delivery of the construction work.
You've recently been asked about your hiring needs for next year and you're wondering whether you should hire two more people. How do you answer this question?
In order to do this, it is necessary to understand whether there really was any impact from the departure of the two operators last year.
Knowing that there is a database with monthly information on materials received and materials transferred, a graph with the monthly trend of this information can be generated. Thus, with this information in hand, a more accurate, data-based decision could be made.
How to present the data?
Let's continue with the example above. Figure 1 shows an example of a common chart with a standard layout.
There are six changes that can be made to this graph to reduce saturation. Let's find out about these changes that can be made to better present the data on the graph.
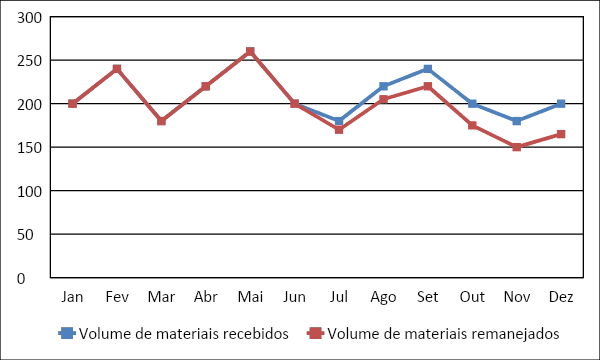
Figure 1 - Original graph
1. Remove the border from the graphic
In general, the edges of graphs are not very effective when it comes to visualizing data. In this case, you can use the white space on the page itself to emphasize the graph and visually distinguish it from the whole.

Figure 2 - Remove the borders from the graph
2. Remove the grid lines
In some specific cases, you can leave the grid lines. However, they should not be a priority in the graphic. So make them thin and use a colorpreferably gray.
The grid lines should not compete visually with the main purpose of the graph, i.e. the data. As a good practice, always try to get rid of the grid lines, as this allows for greater visual contrast and your data will stand out more.

Figure 3 - Remove the grid lines
3. Remove data markers
It's important to remember that each element adds a cognitive load to the audience viewing the data. In this context, the data markers also end up causing greater cognitive weight without, however, adding more information.
In the previous graph (Figure 3), the data is already represented visually by the lines. Thus, the same information was being repeated only in the form of markers, favoring visual saturation.
This doesn't mean that text markers should never be used, but they should be used for a specific purpose, to bring some new informationor insightto the data.
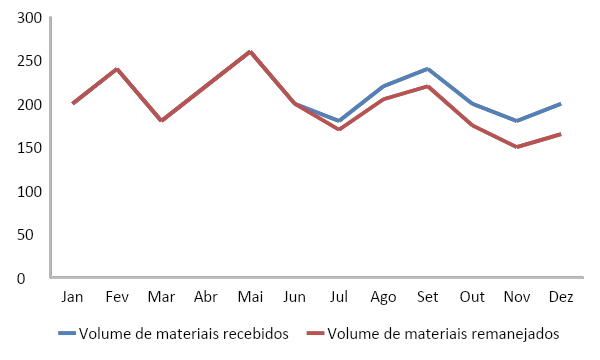
Figure 4 - Remove data markers
4. Caption data directly
By eliminating much of the cognitive load associated with graphic elements, you can also leave some more relevant information, such as the legend.
This method is called the Proximity. Notice that by moving the legend closer to the lines, you can instantly see that the blue line refers to the "Received" item and the red line to the "Reallocated" item.

Figure 5 - Legends the data directly
6. Enhance with consistent colors and sizes
In addition to the Proximity principle, you can also use the Similarityprinciple, making the colors of the legends similar to the colors of the lines.
You can also change the colors of the lines to emphasize the analysis you want to show. Notice that, visually, your attention is now drawn directly to the "Remitted" line, and you will see that it is just below the "Received" line.
This process was intentional in order to emphasize the fact that the number of items relocated fell in relation to the number of items received.

Figure 5 - Use consistent colors and sizes
7. Add some information to the graph
You can also add some small textssuch as the title of the graph and the titles of the axes. Providing the audience with valuable information that will enable them to understand the history of the data in this graphic presentation more efficiently.

Figure 6 - Final graph
Conclusion
Whenever information is placed in front of an audience, a cognitive load is exposed and asked of them. Visual saturation can create an excessive cognitive load which can detract from the real purpose of the data presentation, i.e. its story.
In this article, we discuss practical concepts associated with better data visualization and storytelling.
As a final tip, always try to use the alignment of elements, the presence of white space and contrast strategically. Always bear in mind that saturation is your enemy, so eliminate it from your graphics.