Introduction
In this article, you'll learn how to visualize sales in Google Analytics. That way, you can keep a close eye on your e-commerce and think about the best optimization strategies.
Here's a step-by-step guide to visualizing your company's sales.
Step 1|3
Log in to your company's Analytics account and click on "Acquisition" in the side menu.

Step 2|3
Select the "All traffic" option, then "Source/Media". Under "Users", choose the "Revenue" option.
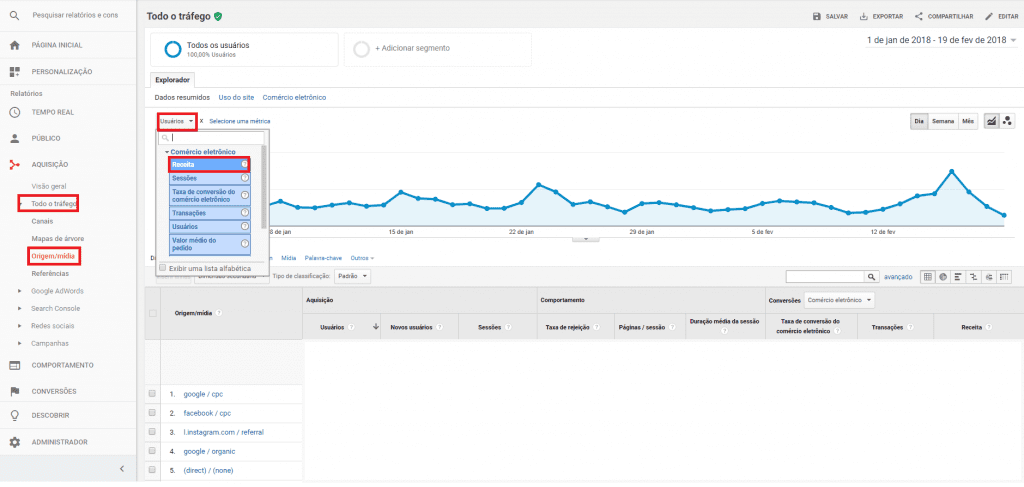
Step 3|3
All you have to do now is select the time window you want to analyze in the top right-hand corner. This way, you'll be able to see all the sales in Google Analytics for that period of time.
It's important to note that e-commerce must be set up on your e-commerce platform.
With this information, many interesting analyses can be made and used to optimize the account!

We've put together some other articles on Google Analytics that might interest you: