Back to Basics!
In this article, we're going to take a closer look at Google Trends so that you can innovate in your digital marketing strategy.
In it you will find a step-by-step guide to analyzing, filtering and comparing the results of search terms over time.
Shall we start looking at the opportunities available on Google Trends?
Comparing similar terms
The first point we'd like to make here is the possibility of comparing terms based on Google Trends data. The idea here is to compare similar searches or similar products to find out which has the highest volume.
Another relevant conclusion is to see if there are any geographical differences between the surveys.
Assuming that your e-commerce has coats and jackets as its main products, note what the result would look like in the example below:
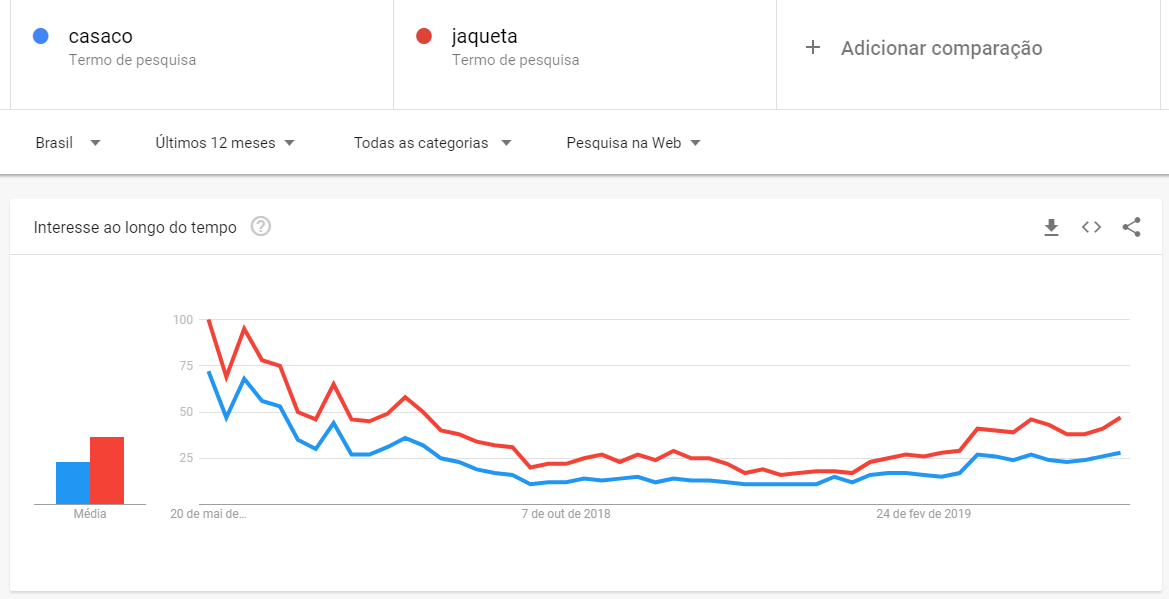

In general, jackets are more popular than coats online. This is a good direction to take when advertising online in Brazil.
On the other hand, if you only sell in Rio de Janeiro, this word might not be the best alternative. This is because there is a greater demand for the term "jackets" in this state.
Now let's look at other options for comparisons. Such as differences in color or gender.
Next, we put the searches for blue or red cars and for men's or women's clothing side by side.
Among the colors, the blue car has a slightly higher performance, but nothing that stands out.
In the case of gender, it can be seen that searches related to women's clothing are much more representative than those related to men's clothing.


Content marketing has to have relevant content!
If you want to do relevant Inbound Marketing that is capable of attracting, converting and engaging customers, you need to develop content that is relevant to them.
So, a practical way to find out if a certain subject is trending or not is to use Google Trends!
There's no point in putting together an excellent SEO strategy or creating incredible articles and blogs if you're talking about fax machines, which today hardly exist anymore....
Unless you're comparing the loss of space in Fax's technology with the future of some technology that's currently on the rise.
Why did we never see anything about scooters two years ago? And why is it that today you can even find analogies between scooters and the financial market (the risk of moving fast and the risk of investing aggressively)?
The answer is here:

That may have been a rather extreme example, but think of all the other topics that are being talked about a lot these days. Do a search on Google Trends, you'll be surprised!
Let's see how the terms Digital Marketing and Fintech have changed over time?


These are hot topics and the greater the demand, the greater the incentive to write content about them. And thus attract more readers and engage more.
However, we must emphasize that using Trends alone as a decision-making process is risky.
Yes, we should use and abuse this tool, but combining it with other sources of information is essential. The more access to information, the better!
Look at how the search for "e-commerce" performs over time.

Looking at this graph alone, there is a very strong disincentive to write about the subject, it seems that E-commerce is in decline.
But that's not what we see in the market. The Webshoppers 2018 survey shows that the market has been growing by an average of 16% a year since 2011.

Are you interested in this research? Want to know more about Webshoppers? Check out this amazing article on the subject!
Trends? Seasonality? What are these things?
What if we download the data from the graph and do a mathematical analysis?
What Google Trends gives us is nothing less than the behavior of a variable over time.
By definition this is characterized as a Time Series and can give us very interesting insights!
We are going to comment here in a simplified way on two very important behaviors: Trends and Seasonality.
Trends
The trend represents the pattern of growth or decline of a variable over time.
It is usually represented by the line that best describes the graph and, in some cases, can be intuitive just by looking at it.
In the examples above, we can clearly see that searches for the terms "Digital Marketing" and "E-commerce" are trending upwards and downwards respectively.
A very simple way to find the Trend of a time series is through Google Sheets.
By downloading the data from Google Trends in csv format and pasting it into Sheets, we can generate a graph and find the trend at the touch of a button.
In the chart editor, there is a "Trend Line" button in the "Series" field, which, when checked, plots this on the chart.
Look at the same examples cited above:


There are other ways of finding this result with greater mathematical refinement. We can use moving averages or linear regressions, for example.
But it's not our aim to go into numerical detail in this article. We want to give you an overview of all the contributions that Google Trends can make to our digital marketing.
Seasonality
Seasonality, on the other hand, is characterized by fluctuations in cyclical behaviour over a shorter period. Like a week, a month, a season or even a year.
We usually carry out this analysis on a month-by-month basis, indicating the months with the highest and lowest searches.
Unlike a trend, seasonality is harder to spot just by looking at a graph, but it is something that can happen.
A clear example is coats and jackets. If we extend the time period, we'll notice search peaks in May and June, the coldest months in Brazil.

However, if we look at searches for Digital Marketing or E-commerce, it is very difficult to reach a trivial conclusion.
To calculate Seasonality in a simple way, we can take the average number of searches each month and divide it by the total average number of searches.
Seasonality January (%) = Average searches in JanuaryAverage searches-1
Look at the month-on-month performance of the examples cited:


You can see how these two graphs talk to each other. Of course, the highs and lows have different intensities in each case, but they occur in similar months.
As with the trend, here too there are other mathematical ways of arriving at this result by eliminating the influence of other factors.
Trend + Seasonality
By combining the macro analysis of the trend with the micro analysis of seasonality, we get powerful information for planning a campaign budget.
With these two, you can understand how a particular product or brand performs over time.
Some may even venture to make projections for future months. It's a difficult task, but one that becomes more tangible with access to this information.
Here at Pareto Group, we have developed a robust mathematical tool that breaks down Trends data into 4 distinct variables!
Our aim here is to make this planning efficient, based on statistical and mathematical data.
Interested? Fill in the contact form on our website!
Conclusion
We then show you some ways to innovate in your Digital Marketing through the use of Google Trends.
All of these suggestions are simple and easy, but they can have a huge impact on your campaigns.
How about starting to run these analyses for the important keywords in your business?
Start with your brand name and then move on to your main products. Over time, you'll have powerful insights in your hands!